Saturday, October 26, 2013

October 26th 2013: Low-volatility vs. High-Beta Stocks

There was a very interesting development in the markets this week that you might have missed if you just looked at the broader averages.

The stocks that got us to these lofty levels (china stocks, solar stocks, select tech, etc.) are rolling over here -even the small caps closed down on Friday.  In short, high-beta, high-growth is in trouble.

When this happens, there are 3 possible outcomes:
1.  A pause that refreshes and high-beta takes off again
2.  A rotation into low-beta, low-volatility, high-dividend boring stuff (like this Spring)
3.  A decline where the high-beta roll pulls everything else down with it (like the June and August dips)

We're clearly overbought.  $USHL5 just spiked 5000 - which if you follow Alexander Elder is a big red flag and often a leading indicator.  The percentage of stocks over the 50-day SMA is over 80% (which is high, but not extreme).  It doesn't really matter which metric you chose (RSI, MACD, CCI, stochastics, etc.), they're all extended.

So, where are we going next?  I have no idea, but I do know what to watch:  SPLV.

SPLV is busting out of a huge consolidation and could play catch up to SPHB which has enjoyed a good romp for the past few months.  If we take out this week's low in SPLV, all bets are off.  But right now, it looks like all systems go for SPLV and I'll be buying dips.

If my interpretation of the charts is correct, then scenario #2 above is the correct one.

Here's a chart of SPLV and you can decide for yourself:


For more charts and to read a disclaimer, please see my public chart list on stockcharts.com...

Sunday, October 20, 2013

October 20th 2013: Volatility crush drives markets higher

It's been a while, so I feel like I can point out that ignoring the noise/news and trading the charts worked again!

As much as I try not to let the noise (news + opinions) influence my trading, I am aware of some of the prevailing views by other traders out there.  One of the things I heard alot of this week was the "sell the news" trade.  In other words, markets were going to "tank" once a deal was announced.  It seemed like everyone and their brother were ready to jump on this trade.  I have to say that sticking with the trend and watching the charts & patterns worked better than the opinions of others.

(OK, OK - enough on that topic....)

In $SPX land this week, the real keys in my mind were the ability to hold the $1695.93 low, the bull-flag breakout, and the follow-through the next day.

Another factor that I think many people miss is the importance of volatility crush.  Volatility crush is usually associated with the decrease in options pricing following an earnings report.  In this sense, I'm using volatility crush to describe how volatility responds following some "crisis" in the markets.  Once this "crisis" has passed, volatility squeezes out of the market like air rushing out of a balloon.  In this environment, it's very hard for stocks to go down as put buyers and volatility hedgers get squeezed providing rocket fuel for natural buyers of common stock and calls.

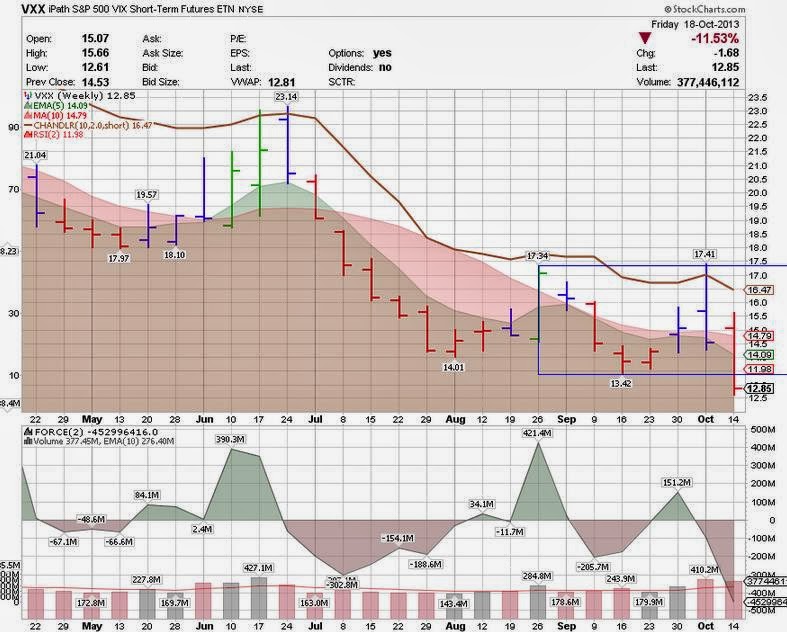
Here's a chart of VXX which illustrates the "volatility crush" this week...
- Last week, we had price stalled at the top of the box
- Last week, we had NegD with FORCE vs. price to set-up the fall
- This week, price broke the bottom of the box with FORCE and volume
- Keep an eye on VXX because it can go a few points lower which would help push the indexes melt up further


For more charts and to read a disclaimer, please visit my public stock charts list on stockcharts.com...
http://stockcharts.com/public/1109955

Monday, September 23, 2013

September 23rd 2013: Ignoring the noise works again!

OK - last post on this topic for a while....

But I'd like to point out that ignoring the news (noise) worked again.  Wherever you turned last week, there were smart, highly- (over?) paid economists and analysts calling for $5B-$15B of tapering.  I think they all went to the same school because the numbers were all very close - at least the ones that I heard by accident.

How did that work out for them?  Did they save their clients money by advising them to be "careful" or "cautious"?  Did they get a bigger bonus?  Did they still collect $250K+ for touting their [very wrong] opinions?  Were they at all remotely helpful in making an investment thesis and executing a plan?  How about those kind fellows that said to buy gold and emerging markets at the top based on continued Fed injections?  Was that helpful?

No, no, no.

If one looked at the $SPX chart, put some ear plugs in, went long on a daily close above 1690 (as I suggested in the last blog post), took profits when available, raised stops to the lows of the previous day, exited remaining shares on stop out, etc. - you would have had a great week.

So what's in store for this week?  As usual, it's helpful to look at the charts.

Last week, we had a long-wicked bearish candle that stuck it's head [briefly] above the box and then retreated to close just above the box (by a few pennies).  Most other indicators are still bullish.

There's 3 scenarios to keep in mind here:
1) We rip higher and close above the box with a strong green bar which would suggest a further box-length move in the direction of the break (up).
2) We rip lower and close below last weeks bearish candle which would suggest we attack the lower edge of the box (August lows).
3) We drift sideways and frustrate both bulls and bears.

My 2 cents is that we drift sideways (#3).  After a strong push with FORCE last Wed, it would be unusual to see us just give up and tank.  More often, we see a pause, retest that bar, and then roll if that's the direction the market ultimately takes.  Additionally, most weekly indicators are still bullish and we usually take a couple weeks of neutral bars before we start to roll (see May and June peaks).

Here's the chart:


For more charts and to read a disclaimer, please visit my public chart list on stockcharts.com...

Saturday, September 14, 2013

September 14th 2013: Ignoring the news (noise)!

From the sounds of the financial media, we're heading for global disaster next week.  We've got lots of things to worry about:  Syria, Debt, Larry Summers, the FED meeting, quadruple witching, etc., etc., etc.  You'd think we'd be down 30 handles on the $SPX in anticipation of such gloom and doom...but that's obviously not what happened last week.

When I look at the chart of the $SPX, I see a market that's in an uptrend making higher highs and higher lows.  Has the market sufficiently discounted all of the bad news in August and now we're bouncing in relief?  Or perhaps some very smart (or more accurately, very well connected individuals) have a better handle on next week and are betting accordingly?  For whatever reason, the market looks like it wants higher prices.  Other than being overbought and the volume being light (typical), the technicals look solid.

Here's a thought exercise: pick a time period in the past when we ripped higher for a few weeks.  Do you remember the news that fed that rally?  Do you remember what fears were overcome to squeeze the bears and prod under-invested bulls to commit more capital?  Most people can't remember.  I sure as heck can't remember and it doesn't really matter either because the charts tell the story.

To sum up:  the market discounts readily available public news, some nefarious people know the outcome before the news is released, and the charts will conveniently consolidate all of this and more into price patterns for us to trade.

Here's my trade:  long on a close above 1690 with a stop below.

Here's the chart...

For more charts and to read a disclaimer, please visit my public chart list on stockcharts.com....

Saturday, August 31, 2013

August 31st 2013: If the US dollar goes higher, where does everything else go?

Hint:  Lower.

Once again, there's not a shortage of things to talk about this week.  In no particular order, we could talk about:

1) Small-caps breaking down  ($SML)
2) Mid-caps breaking down ($MID)
3) Europe rolling over hard after displaying RS
4) The big moves in the $VIX and loosely-related ETF cousins (VXX, XIV)
5) The persistent weakness in the $INDU's and $TRAN
6) The stubborn stickiness of the $NDX (QQQ) and its resistance to rolling over

But I don't have time to write 6 additional blog posts, so I'm just going to pick the most important one:  $USD/UUP

Let's take UUP as a proxy for the $USD since I can easily get volume and it's easier to see the trends.

On the bull side of the ledger, we have:
1) Higher low and higher high on the daily chart of UUP
2) Down-trend appears broken on the weekly chart with a close above previous week's high @ 22.07
3) Elder Impulse Bars turned blue (neutral) and stayed blue after weeks of being red.
4) Price closed above 5-week EMA
5) FORCE(2) is green and trending up
6) FORCE(2) on the downside was light as price was testing previous lows @ 21.82-22
7) Price bounced off clear support at 21.82-22

On the bear side, we have:
1) Weak volume
2) Price is below 10w SMA
3) Bearish 5w EMA x 10w SMA cross still in play
4) Price is below Chandelier Stop line (10,2)

I can sort of wave away the downside arguments as being symptomatic of being early in the trade.  If the UUP starts ripping higher, I would expect the other indicators to catch up.  If we break 21.82, then clearly something went wrong with my thesis.

Overall, the bullish aspects of a UUP long trade have much more appeal and we could easily see the top of the recent range at 22.94.  We've been in a range of 21.50 to 23 for almost 2 years on the UUP, so a move higher within that range is certainly within the realm of possibilities.  In fact, you could argue that it's just normal chop within a box (range).

So, what does a $1.50 pop in UUP mean for the rest of the world?  My take is that it means a great deal for commodities, stocks - and emerging markets specifically, and even the stubbornly sticky QQQ.

If you're only going to look at 1 chart every day, this would be a good one to watch.

Here's the chart:

For more charts and to see a disclaimer, please read my public charts at stockcharts.com:


Sunday, August 18, 2013

August 18th 2013: Is junk the new high-beta?

We could talk about alot of things this week:
1) The continued dramatic weakness in commercial real estate (something I flagged last time)
2) The amazing run that AAPL has had lately pushing prices back to pre-2013 levels and buoying the Q's (see older post for my take on AAPL as it starting to turn)
3) The big push higher in GDX (also something that I flagged earlier)

But that's all old news.

What was most surprising to me this week was the relative outperformance of Europe while the SPY's were breaking down - especially Italy.  Yes, Italy.  The country that the media would have had you to believe was going to take down Europe and by extension kill the nascent recovery in the US, speed China's demise, and send the world into global economic recession.  That Italy!  (I try to avoid reading the news because it's misleading [at best], but sometimes a little bit of news slips in).

Here's what I see from the chart...
1) Price is breaking out of a box.
2)  MA's are trending up.
3) Price is above the Chandelier Exit Line
4) Elder Impuse Bars are green
5) RSI(2) is 99+
6) FORCE(2) is green

Pretty impressive stuff!  The only negatives that I see is the lower peak in FORCE (vs. the April surge) which is due to the below average volume.  This could be a seasonal issue as I understand that EVERYONE in Italy is on vacation in August (which makes me wonder how anything gets done...).

I'd rather not be long Italy because of political risk, but VGK and EZU are two strong Europe-based ETFs that are also outperforming vs. the $SPX.  It's a very interesting divergence to see Europe leading the US when so often it's been pulling the US indexes down.  I would expect Europe to lead again once the SPY's recover.

Another aspect to consider is that junk is leading now simply because of rotation.  Gold miners, Italy, and other chronic underperformers are suddenly getting a bid.  Regardless of the reasons, the important part is that they are moving higher.

Here's the chart...

For more charts (and less commentary), please visit my public chart list on Stockcharts.com.  Also check out the disclaimer there.
http://stockcharts.com/public/1109955


Sunday, August 4, 2013

August 4th 2013: Shades of 2007 in Commercial Real Estate?

Starting in 2007, commercial real estate (IYR) started vastly underperforming the ($SPX/SPY's).  Then, there was a big rebound off the March 2009 bottom after China bottomed in late 2008 with real estate leading, both in terms of relative performance and absolute returns.  And now we're seeing IYR leading to the downside again.

I like paying attention to price performance rather than opinions.  I'm sure there's lots of smart people jumping up and down and saying to buy or sell IYR right now based on some well-though-out, cogent arguments.  The trouble is that someone is wrong and I'm not clever enough to know which well-educated person is correct.  On the other hand, stock prices are always correct in the sense that they reflect matched prices for buyers and sellers at a particular moment in time, but I digress...

Here's what I see:  for whatever important reason, IYR is heading down and dramatically underperforming the SPY's as the SPY's are reaching all-time highs.  This week, not only did IYR fail to break out of a potential flag pattern, it broke down below MA support lines and the chandelier exit line.  In doing so, it appears headed for the bottom of the blue box @ $62.72.  If $62.72 should fail, there is a large inverse cup & handle bearish pattern which, if completed, would send prices much, much lower.  The only mild positives are that volume came in just above average and FORCE is still less than the June lows.


Good luck out there and may the FORCE index be with you in your trades.

For more charts and a disclaimer, please see my public chart list on stockcharts.com.