Answer: How the heck would I know; I don't have a crystal ball.
Here's something that I wish someone had told me when I was younger: most predictions for next year will be wrong. Here's another one: humans suffer horribly from bias. They're biased by where they get their paycheck, they're biased by the need to predict the future, they're biased by recent history, etc., etc. As an example, if Year 1 was up 25%, your friend the stock broker from big bank brokerage A will jump on TV and predict Year 2 will be up 10-15% based on X,Y, Z logical and usually fundamental arguments. Similarly, the guy from the bear shop will say stocks are going to crash. Every year, he'll say the same foolish thing and he'll be right 1 or 2 years out of 10. The guy from the bond shop will say to buy bonds for the long-term to reduce volatility in your portfolio. You can watch them on mute and fill in the words yourself because on average they'll all say the same thing depending on their individual biases, employers, and current portfolio position.
Anyway, my main point was not to rip on talking heads on TV....
I think it's much more valuable to talk about possibilities for 2014. There's an important distinction between possibilities and predictions. Possibilities offer a potential road map. Predictions are an imperfect attempt at defining the future. The key distinction for me is that the charts will tell me if I'm on the wrong potential path and I can get the heck out of the way.
Here's some possibilities for 2014 (and a brief rationale):
- $SPX:$USB ratio tags its 1999-2000 high of ~16. (Trend is in place and can hit top of prior range - especially if money flows out of bonds and into stocks).
- $COPPER gets a bid after 3 years of neglect and runs up to the top of its range @ $4.50 per pound. (Some nice bullish divergences showing on the monthly RSI(2) chart.)
- $XJY (japanese yen) continues to slide against major currencies until it finds support in the low 80's. (Breaking down below $96 and trend is in place).
- $GOLD (& $SILVER) experience a vicious short-covering rally. ($SILVER is finally outperforming $GOLD and historically, that's been a clue that prices can rip higher.)
- $TYX (30-year bond yield) hits 4.5%. (Trend is in place and can hit top of prior range).
- $WTIC continues sideways between $115 and $75. (Competing RSI(2) monthly chart divergences suggest range bound trade for now).
- $NATGAS surprises to the upside despite reports of large supply. (Cup and handle target is close to old resistance at $6.11).
- Industrials, XLI, (led by shippers: SEA) outperform the $SPX in 2014. (Trend is already in place for XLI, shippers could add more fuel.)
- Metals (XME, SLX) are surprise leaders for 2014 and play catch up to the rest of the materials sector. (Monthly charts look bullish for the first time in 3 years).
- $VIX remains trapped in the 10-20 range. Brief forays above 20 will be buying opportunities for equities. (Monthly $VIX chart looks bearish to flat.)
So those are some of things that I'll be watching for in 2014. IF the right set-up comes along, I'll be jumping on a few of these. Good luck to all!
Friday, December 27, 2013

Saturday, December 7, 2013
December 7th 2013: What's up with energy stocks?
Once again this week, there's too much for me to cover in a single blog post....
In no particular order:
- The relative out-performance of industrials & health-care vs. almost every other market sector
- The relative out-performance of large caps on Friday (vs. small & mid caps)
- The relative out-performance of low-vol vs. high-beta on Friday (SPLV vs. SPHB)
- The accumulation day on Friday and what that means for the market (short version: as long as Friday's lows hold, I expect a grind upward into year-end. Accumulation/Distribution days act as anchor points.)
- Gold & Silver & related miners
- Bonds & Yields
- Trends in Natgas, Crude, and the Gasoline:Crude spread
The most surprising thing to me that happened this week was the action in energy stocks. Forget IOC blowing up; check out the action in the former energy leaders. For example, on Friday, the INDU's are up 200 pts and many of the former leaders in energy, including: OAS, PXD, EOG, not to mention solar names, were getting hammered. That's the epitome of poor relative strength in the face of rising oil prices and buoyant stock market - a big, giant red flag. The large caps energy names (XOM, CVX) and refiners were holding up the whole sector so the headline prices of the energy index were well-contained, but the action under the surface was ugly. It won't take much for the energy sector to completely rollover. Technical indicators for the broader market suggest to me that the probabilities are for higher prices, but if we do rollover watch for energy to lead on the downside. They also have the potential as a hedge while playing other sectors (like industrials).
Here's a chart:

In no particular order:
- The relative out-performance of industrials & health-care vs. almost every other market sector
- The relative out-performance of large caps on Friday (vs. small & mid caps)
- The relative out-performance of low-vol vs. high-beta on Friday (SPLV vs. SPHB)
- The accumulation day on Friday and what that means for the market (short version: as long as Friday's lows hold, I expect a grind upward into year-end. Accumulation/Distribution days act as anchor points.)
- Gold & Silver & related miners
- Bonds & Yields
- Trends in Natgas, Crude, and the Gasoline:Crude spread
The most surprising thing to me that happened this week was the action in energy stocks. Forget IOC blowing up; check out the action in the former energy leaders. For example, on Friday, the INDU's are up 200 pts and many of the former leaders in energy, including: OAS, PXD, EOG, not to mention solar names, were getting hammered. That's the epitome of poor relative strength in the face of rising oil prices and buoyant stock market - a big, giant red flag. The large caps energy names (XOM, CVX) and refiners were holding up the whole sector so the headline prices of the energy index were well-contained, but the action under the surface was ugly. It won't take much for the energy sector to completely rollover. Technical indicators for the broader market suggest to me that the probabilities are for higher prices, but if we do rollover watch for energy to lead on the downside. They also have the potential as a hedge while playing other sectors (like industrials).
Here's a chart:

Here's what I see:
- Poor RSI
- Nested box formation
- Small box is a tight range consolidation
- The bottom of the large box is the target on a break of the small box
For more charts and to read a disclaimer, please visit my public chart list on stockcharts.com....
Sunday, November 24, 2013
November 24th 2013: The Kirk Report for $100, Alex?
For the not-so-princely sum of $100 per YEAR (not per month), you can have access to the trading brain of Charles Kirk via his namesake, The Kirk Report.
Charles brings with him an extreme work ethic that helped him turn a tiny $2K porfolio into a relatively huge $7M account. I haven't done the math to figure out the average yearly compounding, but we can say for sure that he's done well at trading. At this stage, he can afford a more balanced life, but that doesn't seem to diminish from the virtual fire hose of information that he shares daily via email updates (pre and post market updates), weekend updates (flipboard magazine and week-in-review video), as well as a real-time, twitter-like, link-fest called the "Notebook".
In general, some of my favorite posts are the in-depth interviews with other traders who have reached that elite multi-million (or higher) status. It's Jack Schwager's Stock Market Wizards in real-time. Where else are going to find this stuff? One of my all-time favorite posts of his was a 2012 "self interview" titled simply, "How I made 54K last week".
Perhaps his greatest talent is the ability to see and map out price patterns and possibilities in the S&P500 chart on multiple time frames (from weekly to 1 min charts). He identifies the patterns (mainly cup & handle and variants like head & shoulders) that seemingly everyone (including the HFT algo's) are watching. Even if you don't trade patterns, it's useful to be aware that he's trading them, other pattern traders are trading them, and the algo's are trading them. The completion or failure of these bullish or bearish patterns also gives a sense of the strength of the underlying trend. For example, if the bearish pattern currently in play fails, a bullish one will often form and succeed.
Where else might you spend $100 on trading this year?
- 5 round trip trades?
- A tight stop?
Consider joining the Kirk Report for 2014 and earning a multiple of your $100 back.
In full disclosure, Charles is offering a "End of Year Drawing" with prizes for positive reviews. My personal win-rate with random events like drawings is close to zero, so don't let the drawing color your interpretation of my review.
Charles brings with him an extreme work ethic that helped him turn a tiny $2K porfolio into a relatively huge $7M account. I haven't done the math to figure out the average yearly compounding, but we can say for sure that he's done well at trading. At this stage, he can afford a more balanced life, but that doesn't seem to diminish from the virtual fire hose of information that he shares daily via email updates (pre and post market updates), weekend updates (flipboard magazine and week-in-review video), as well as a real-time, twitter-like, link-fest called the "Notebook".
In general, some of my favorite posts are the in-depth interviews with other traders who have reached that elite multi-million (or higher) status. It's Jack Schwager's Stock Market Wizards in real-time. Where else are going to find this stuff? One of my all-time favorite posts of his was a 2012 "self interview" titled simply, "How I made 54K last week".
Perhaps his greatest talent is the ability to see and map out price patterns and possibilities in the S&P500 chart on multiple time frames (from weekly to 1 min charts). He identifies the patterns (mainly cup & handle and variants like head & shoulders) that seemingly everyone (including the HFT algo's) are watching. Even if you don't trade patterns, it's useful to be aware that he's trading them, other pattern traders are trading them, and the algo's are trading them. The completion or failure of these bullish or bearish patterns also gives a sense of the strength of the underlying trend. For example, if the bearish pattern currently in play fails, a bullish one will often form and succeed.
Where else might you spend $100 on trading this year?
- 5 round trip trades?
- A tight stop?
Consider joining the Kirk Report for 2014 and earning a multiple of your $100 back.
In full disclosure, Charles is offering a "End of Year Drawing" with prizes for positive reviews. My personal win-rate with random events like drawings is close to zero, so don't let the drawing color your interpretation of my review.
Monday, November 11, 2013
November 11th 2013: The importance of staying solvent...
"Markets can remain irrational a lot longer than you and I can remain solvent".
- John Maynard Keynes
ref.:http://en.wikiquote.org/wiki/John_Maynard_Keynes
On Thursday, the Dow busted its highs and then quickly reversed with volume on the downside. The weak bounce into 12N had little volume, so I went short the Dow (and the S&P500 for good measure) right around 12N. Nice entry. Superior risk/reward over some other plays that I considered (including financials) and the market went my way the rest of the day and it was a nice easy ride down. Don't you love it when a plan comes together? I mean it was picture perfect distribution day with bearish engulfing candle that swallowed the last week's worth of price action and destroyed some bullish price patterns in the process. And I was feeling rather pleased with myself.
Then, the payroll numbers hit @ 8:30A on Friday. Bizarrely strong considering the fiasco in Washington, but I don't pay too much attention to fundamentals. Bond market tanks immediately. Dollar is flying, but fades intraday. Equities dip slightly then recover fast and level out until 3:30P. Financials absolutely ripped higher.
Perhaps I should have covered immediately. Perhaps I should have gotten long something...anything really. Instead, I just watched my gains evaporate and come just shy of my stop (Thursday's highs). And while I was watching the market (equities, bonds, currencies), my thought was "are we really doing this? really?" Are we really going to have an accumulation day up here after we just ripped almost non-stop from the October lows? Yup.

I stopped myself out today (Monday) and flipped long (small) in regional banks and solar. My losses were small (because I had a good entry). And it stings giving back those nice profits - especially since the odds of getting an accumulation day after a distribution up here were extremely low. But it would be far worse to stubbornly hold onto my position when the market is doing the opposite of my expectations.
Repeat after me:
"The market can remain irrational a lot longer that you and I can remain solvent".
For more charts and to read a disclaimer, please visit my public chart list on stockcharts.com...
http://stockcharts.com/public/1109955
- John Maynard Keynes
ref.:http://en.wikiquote.org/wiki/John_Maynard_Keynes
On Thursday, the Dow busted its highs and then quickly reversed with volume on the downside. The weak bounce into 12N had little volume, so I went short the Dow (and the S&P500 for good measure) right around 12N. Nice entry. Superior risk/reward over some other plays that I considered (including financials) and the market went my way the rest of the day and it was a nice easy ride down. Don't you love it when a plan comes together? I mean it was picture perfect distribution day with bearish engulfing candle that swallowed the last week's worth of price action and destroyed some bullish price patterns in the process. And I was feeling rather pleased with myself.
Then, the payroll numbers hit @ 8:30A on Friday. Bizarrely strong considering the fiasco in Washington, but I don't pay too much attention to fundamentals. Bond market tanks immediately. Dollar is flying, but fades intraday. Equities dip slightly then recover fast and level out until 3:30P. Financials absolutely ripped higher.
Perhaps I should have covered immediately. Perhaps I should have gotten long something...anything really. Instead, I just watched my gains evaporate and come just shy of my stop (Thursday's highs). And while I was watching the market (equities, bonds, currencies), my thought was "are we really doing this? really?" Are we really going to have an accumulation day up here after we just ripped almost non-stop from the October lows? Yup.

I stopped myself out today (Monday) and flipped long (small) in regional banks and solar. My losses were small (because I had a good entry). And it stings giving back those nice profits - especially since the odds of getting an accumulation day after a distribution up here were extremely low. But it would be far worse to stubbornly hold onto my position when the market is doing the opposite of my expectations.
Repeat after me:
"The market can remain irrational a lot longer that you and I can remain solvent".
For more charts and to read a disclaimer, please visit my public chart list on stockcharts.com...
http://stockcharts.com/public/1109955
Sunday, October 27, 2013
October 27th 2013: Unadjusted vs. adjusted charts
This morning, I woke up and I had this dreadful feeling that I posted the "adjusted" chart of SPLV and not the "unadjusted" chart. (Does this ever happen to you?) In case you are not familiar, unlike most charting programs, stockcharts corrects for dividends, splits, etc. in their standard charts. For stocks that are dividend-heavy, this can make a big difference in their longer-term charts. There is a vigorous debate over which format is the "most correct". For most of my work, I don't care either way.
However, in this case, I feel like the "unadjusted" chart is more accurate albeit somewhat less compelling. The song remains the same: watch the low-vol ETF to determine if the rotation away from high-beta is happening or not.

However, in this case, I feel like the "unadjusted" chart is more accurate albeit somewhat less compelling. The song remains the same: watch the low-vol ETF to determine if the rotation away from high-beta is happening or not.

Saturday, October 26, 2013
October 26th 2013: Low-volatility vs. High-Beta Stocks
There was a very interesting development in the markets this week that you might have missed if you just looked at the broader averages.
The stocks that got us to these lofty levels (china stocks, solar stocks, select tech, etc.) are rolling over here -even the small caps closed down on Friday. In short, high-beta, high-growth is in trouble.
When this happens, there are 3 possible outcomes:
1. A pause that refreshes and high-beta takes off again
2. A rotation into low-beta, low-volatility, high-dividend boring stuff (like this Spring)
3. A decline where the high-beta roll pulls everything else down with it (like the June and August dips)
We're clearly overbought. $USHL5 just spiked 5000 - which if you follow Alexander Elder is a big red flag and often a leading indicator. The percentage of stocks over the 50-day SMA is over 80% (which is high, but not extreme). It doesn't really matter which metric you chose (RSI, MACD, CCI, stochastics, etc.), they're all extended.
So, where are we going next? I have no idea, but I do know what to watch: SPLV.
SPLV is busting out of a huge consolidation and could play catch up to SPHB which has enjoyed a good romp for the past few months. If we take out this week's low in SPLV, all bets are off. But right now, it looks like all systems go for SPLV and I'll be buying dips.
If my interpretation of the charts is correct, then scenario #2 above is the correct one.
Here's a chart of SPLV and you can decide for yourself:


For more charts and to read a disclaimer, please see my public chart list on stockcharts.com...
Sunday, October 20, 2013
October 20th 2013: Volatility crush drives markets higher
It's been a while, so I feel like I can point out that ignoring the noise/news and trading the charts worked again!
As much as I try not to let the noise (news + opinions) influence my trading, I am aware of some of the prevailing views by other traders out there. One of the things I heard alot of this week was the "sell the news" trade. In other words, markets were going to "tank" once a deal was announced. It seemed like everyone and their brother were ready to jump on this trade. I have to say that sticking with the trend and watching the charts & patterns worked better than the opinions of others.
(OK, OK - enough on that topic....)
In $SPX land this week, the real keys in my mind were the ability to hold the $1695.93 low, the bull-flag breakout, and the follow-through the next day.
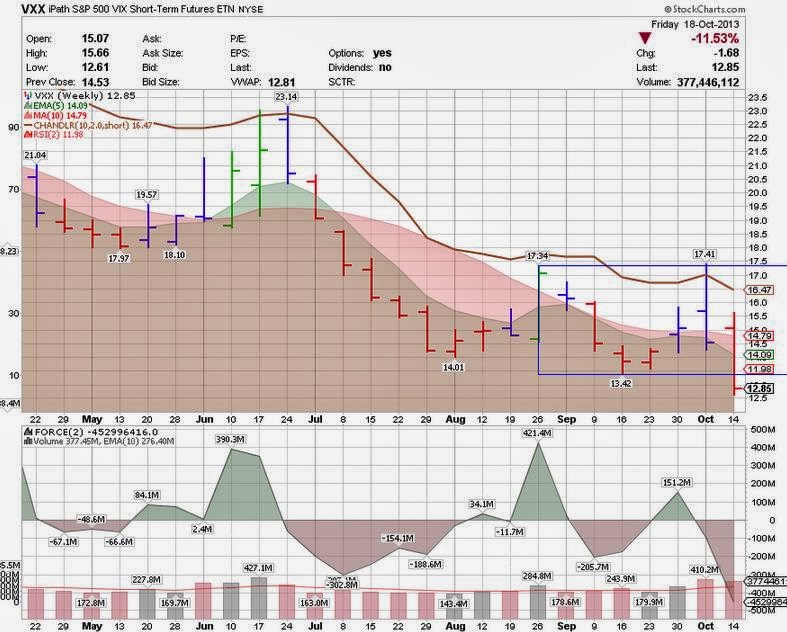
Another factor that I think many people miss is the importance of volatility crush. Volatility crush is usually associated with the decrease in options pricing following an earnings report. In this sense, I'm using volatility crush to describe how volatility responds following some "crisis" in the markets. Once this "crisis" has passed, volatility squeezes out of the market like air rushing out of a balloon. In this environment, it's very hard for stocks to go down as put buyers and volatility hedgers get squeezed providing rocket fuel for natural buyers of common stock and calls.
Here's a chart of VXX which illustrates the "volatility crush" this week...
- Last week, we had price stalled at the top of the box
- Last week, we had NegD with FORCE vs. price to set-up the fall
- This week, price broke the bottom of the box with FORCE and volume
- Keep an eye on VXX because it can go a few points lower which would help push the indexes melt up further

For more charts and to read a disclaimer, please visit my public stock charts list on stockcharts.com...
http://stockcharts.com/public/1109955
As much as I try not to let the noise (news + opinions) influence my trading, I am aware of some of the prevailing views by other traders out there. One of the things I heard alot of this week was the "sell the news" trade. In other words, markets were going to "tank" once a deal was announced. It seemed like everyone and their brother were ready to jump on this trade. I have to say that sticking with the trend and watching the charts & patterns worked better than the opinions of others.
(OK, OK - enough on that topic....)
In $SPX land this week, the real keys in my mind were the ability to hold the $1695.93 low, the bull-flag breakout, and the follow-through the next day.
Another factor that I think many people miss is the importance of volatility crush. Volatility crush is usually associated with the decrease in options pricing following an earnings report. In this sense, I'm using volatility crush to describe how volatility responds following some "crisis" in the markets. Once this "crisis" has passed, volatility squeezes out of the market like air rushing out of a balloon. In this environment, it's very hard for stocks to go down as put buyers and volatility hedgers get squeezed providing rocket fuel for natural buyers of common stock and calls.
Here's a chart of VXX which illustrates the "volatility crush" this week...
- Last week, we had price stalled at the top of the box
- Last week, we had NegD with FORCE vs. price to set-up the fall
- This week, price broke the bottom of the box with FORCE and volume
- Keep an eye on VXX because it can go a few points lower which would help push the indexes melt up further
For more charts and to read a disclaimer, please visit my public stock charts list on stockcharts.com...
http://stockcharts.com/public/1109955
Subscribe to:
Posts (Atom)